Dashboard
Layout
Let's take a tour of the Dashboard.
Appbar
Shows high-level Couchbase and FHIR server status and provides quick actions:
- Connection indicators (Couchbase connection, bucket readiness, FHIR initialization)
- Notifications
- Theme toggle (light/dark)
- Help and Feedback
- User menu (avatar): Profile, Change Password, Sign out
Navbar
Left-side navigation for common areas:
- Dashboard (current)
- Buckets — manage the FHIR bucket and indexes. See docs/Admin UI/Admin - Buckets.mdx
- Resources — browse and manage FHIR resources. See docs/Admin UI/Admin - Resources.mdx
- Validation — mode/profile overview. See docs/Install Couchbase FHIR Server/Validation.md
- Users, API Tokens, Client Registration, Logs (available depending on setup)
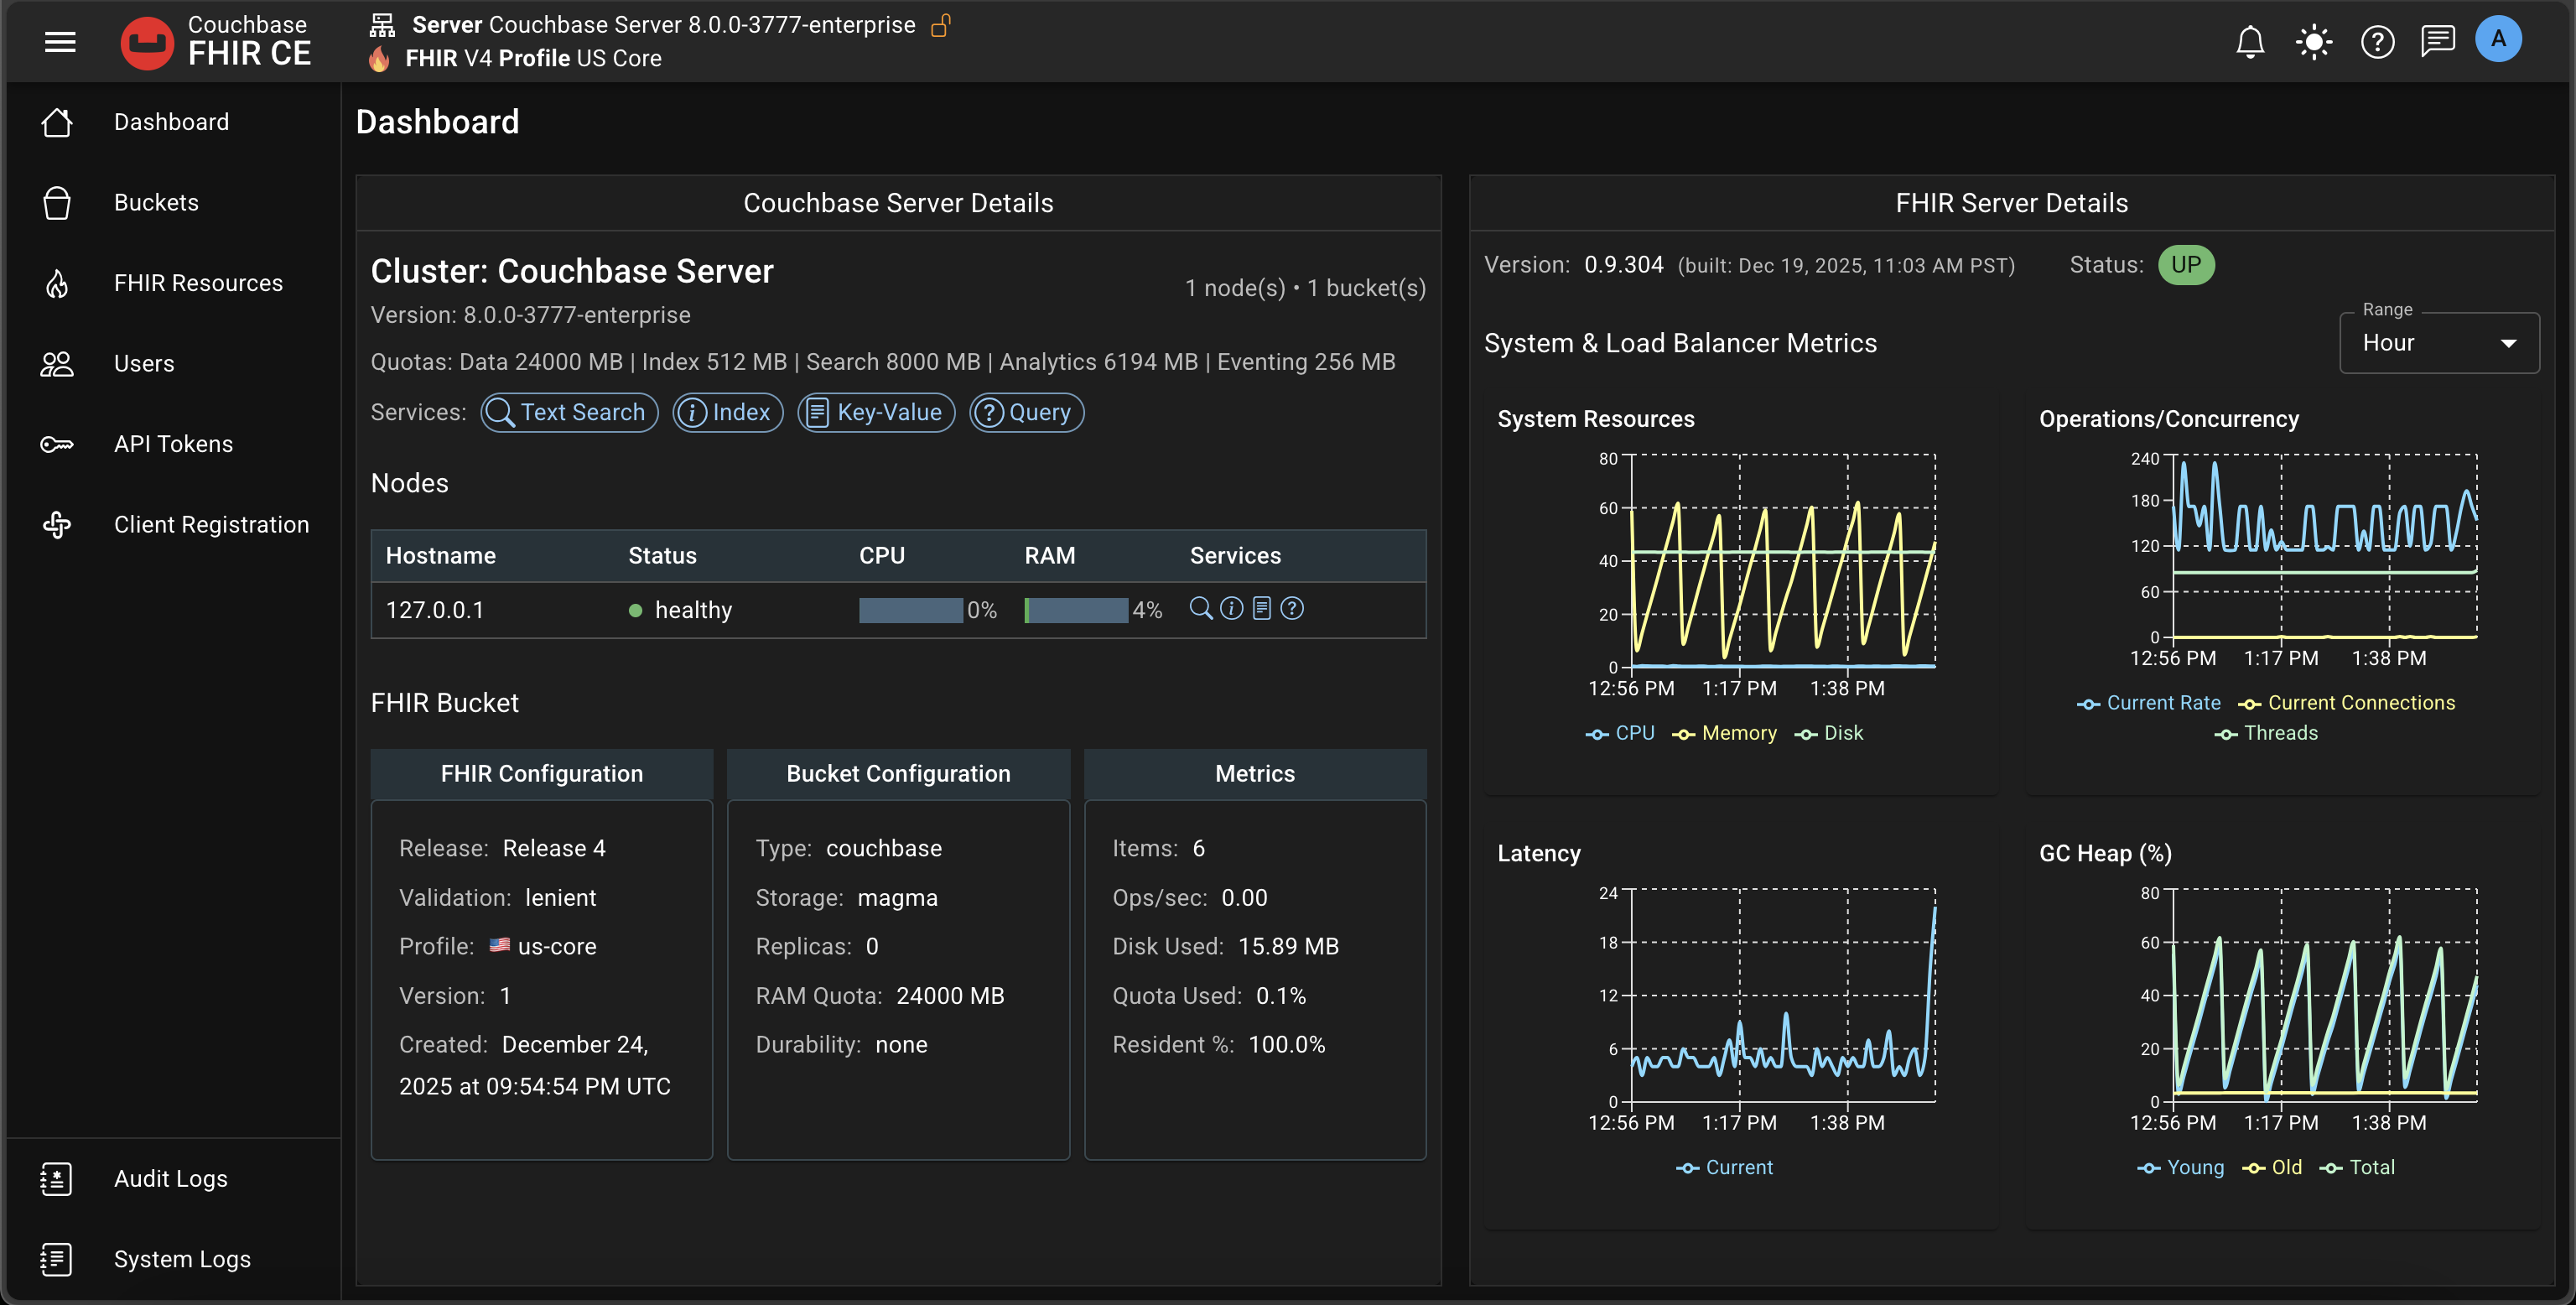
Main Panel
Couchbase Server
Shows Couchbase cluster information and bucket metrics:
- Cluster nodes and health
- Target bucket: name (
fhir), memory/resident ratio - Basic metrics (ops/sec, disk usage, item count)
- Index status (FTS/GSI)
FHIR Server & Load Balancer
System and traffic charts:
- CPU and memory usage
- Operations throughput and concurrency
- Latency percentiles (e.g., P50/P95)
- JVM heap, GC activity, metaspace/buffers
- Load balancer request rate and error counts (4xx/5xx)
Charts update periodically to reflect live activity.
Quick Actions
- Change admin password: Avatar → Change password
- Open Buckets: Manage scopes/collections and indexes
- View Logs: Tail application logs for troubleshooting
Tips
tip
If charts appear empty, verify the Couchbase connection and that the FHIR bucket is initialized.
note
Configuration changes (memory, logging, baseUrl, TLS) should be made in config.yaml and applied with ./scripts/apply-config.sh. See the install docs for details.